
01
Welcome to StreetLight Spectrum
If you’ve ever opened a Depth of Market (DOM) ladder and wondered what all those changing numbers mean, this beginner-friendly guide is for you.
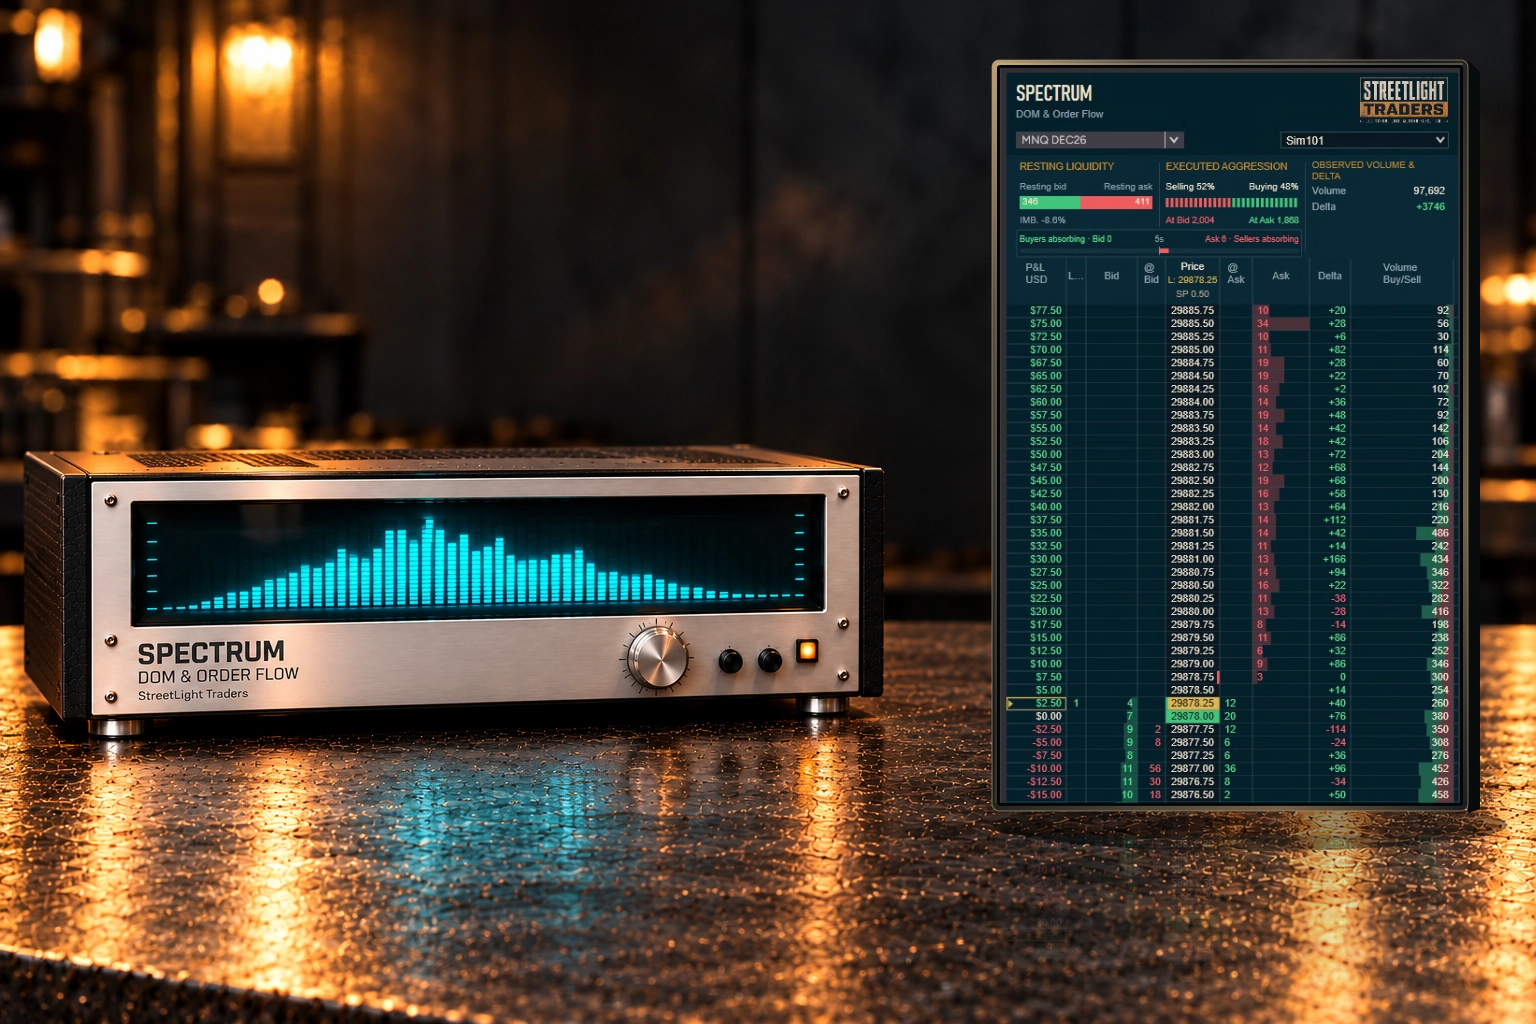
StreetLight Spectrum is a free, read-only DOM and order-flow tool for NinjaTrader Desktop, built around one simple principle: show useful market information without making the experience unnecessarily complicated.
We built Spectrum around the information we use in our own trading: resting liquidity, executed buying and selling, volume, delta, and potential absorption.
Could we have added more features? Absolutely.
But our goal wasn’t to build the most complicated DOM on the market. It was to create a clean, responsive tool that helps traders become more comfortable observing the order book.
More advanced platforms offer additional capabilities that may be useful for different trading styles. If your approach eventually requires those capabilities, there are specialist tools worth exploring.
We chose to keep Spectrum focused.
Simplicity Wins.
Two sides of the market
Think of the DOM as two conversations happening at once.
One shows the orders waiting to buy or sell.
The other shows trades that have actually happened.
Spectrum brings those observations together in one price ladder, helping you see where buy and sell orders are waiting, where trading activity is taking place, and how price responds.
The purpose is visibility—not prediction.
Built for visibility, not prediction
Spectrum helps you observe market activity. It doesn’t tell you when to enter a trade, where to place a stop, or which direction the market will move.
A large bid isn’t a guarantee of support. Positive delta isn’t automatically a buy signal. And potential absorption doesn’t promise a reversal.
These are observations you can consider alongside price action and your own trading approach.
We demonstrate. We don’t dictate.
Understanding your market data
Spectrum works with the market data available through your NinjaTrader connection. The information you receive may vary depending on your broker, data provider, and market-data subscription.
If you’re trading through a proprietary trading firm (prop firm), check directly with your firm to understand which market-data level is included with your account and whether additional depth is available. Different prop firms have different arrangements, requirements, and upgrade procedures.
There are two common levels of market data:
Level 1 (top-of-book) typically provides the best available bid and ask prices, along with trade information. You can begin observing price and executed trading activity with this data.
Level 2 (market depth) provides additional visibility into resting buy and sell orders at multiple price levels.
These resting orders are commonly referred to as displayed liquidity: orders currently visible in the order book, waiting to be matched with buyers or sellers.
For a more complete experience with Spectrum’s depth-of-market features, we recommend considering Level 2 access.
Before subscribing, make sure you understand what your broker or prop firm provides, which exchanges and instruments are covered, and what additional fees may apply.
The amount of market depth available depends on your connection, exchange, and subscription. Even with Level 2 access, you won’t necessarily see every order in the market, and displayed resting orders can change or disappear.
We’ll explore market-data subscriptions, exchange coverage, and the differences between Level 1 and Level 2 in a separate StreetLight guide.
Free means free
Spectrum’s DOM and order-flow features are free to use. No StreetLight product purchase is required.
There is no separate paid edition of Spectrum with additional order-flow analysis.
If you also use StreetLight Cassette Deck, Spectrum can display additional account, position, and P&L information alongside the price ladder.
That’s the only difference. Cassette integration adds position visibility; it doesn’t change the market information Spectrum provides.
Cassette Deck is available separately for $89 USD as a one-time purchase.
Spectrum itself remains free. Any market-data subscriptions or exchange fees are separate and depend on your provider.
Getting started
You don’t need to understand every number on the ladder before you begin.
Start with three things:
- Watch the orders waiting at each price.
- Watch the trades actually executing at those prices.
- Observe how price responds.
As you become more comfortable, the other columns and summaries will begin to make sense.
The following sections will walk you through installation, understanding the ladder, interpreting Spectrum’s measurements, customizing your workspace, connecting Cassette Deck, and troubleshooting common issues.
Learn it here. Recognize it anywhere.
Back to top ↑02
Installation
Use the packaged Spectrum release supplied by StreetLight Traders. You install one Spectrum ZIP; you do not install a separate ZIP for every component.
- Choose a safe time. Finish or independently manage any active trading before installing software or restarting NinjaTrader. Save your workspace.
- Save the ZIP. Put the supplied Spectrum import ZIP somewhere easy to find, such as Downloads. Leave it intact.
- Open the importer. In NinjaTrader’s Control Center, choose Tools → Import → NinjaScript Add-On….
- Select the Spectrum ZIP. Confirm only prompts for the trusted StreetLight package you intended to install. Let the import finish without errors.
- Fully restart NinjaTrader. Close the platform completely, then reopen it. This is especially important after an update.
- Open Spectrum. Use Control Center → New → StreetLight Spectrum. During candidate testing, the menu name may include an RC version.
If the import reports errors, stop there. An error dialog is not a successful installation. Check the troubleshooting section rather than repeatedly importing duplicate copies.
Menu reference: NinjaTrader’s AddOn installation instructions ↗.
Back to top ↑03
Your first five minutes
- Connect your data feed. Make sure NinjaTrader is receiving prices and market depth for the full contract you intend to observe.
- Choose the instrument. Select the symbol and contract month in Spectrum’s upper-left selector. Check the month; a different expiry is a different instrument.
- Start with Top analyzer. It shows the summaries above the ladder. You can switch to Side analyzer or Compact later.
- Click Center. Bring the current market into view. For a steady ladder, choose Auto-center at edge; use Keep centered if you want the ladder to follow price.
- Let data accumulate. The volume profile starts with Spectrum’s observation, not with the session open. Short-window readings may need time to fill their selected lookback.
- Read one relationship. Compare the orders waiting at a price with the trades executing there, then watch how price responds. There is no need to read every column at once.
Using more than one data connection?
In NinjaTrader, open Tools → Options → Market data → Preferred connections – real-time and check the provider selected for the instrument type, such as Future. That choice concerns market data; the account selected for trading is a separate choice. Historical-data preferences are separate again. Make sure the provider you intend to use supplies the required depth.
An account is not required for the free market display. If you want the linked position features, follow Connect Cassette Deck and begin with a SIM account.
04
Read the DOM: waiting versus executing
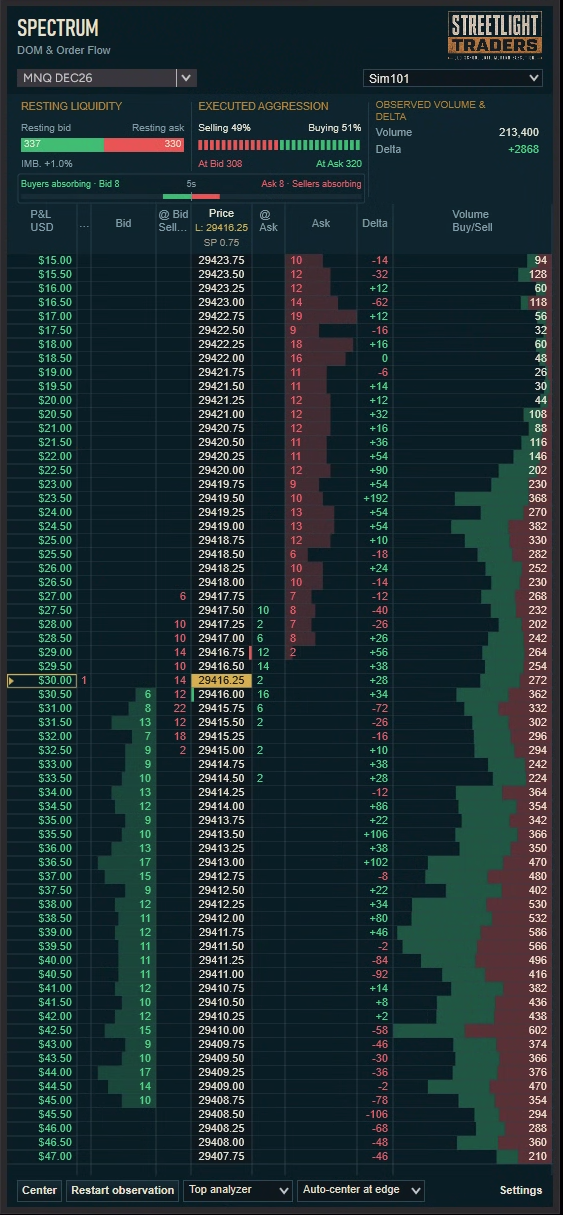
DOM means depth of market. Each ladder row is a price. Higher prices are above lower prices. One step is one tick—the instrument’s smallest price increment.
The important distinction is between a resting order, which is waiting, and an execution, which has already traded.
| What you see | What it means | Default colour |
|---|---|---|
| Resting bid | Buy limit quantity waiting in the displayed book. | Green |
| Resting ask | Sell limit quantity waiting in the displayed book. | Red |
| Selling at bid | Trades classified as sellers executing against resting bids. | Red |
| Buying at ask | Trades classified as buyers executing against resting asks. | Green |
Every completed trade has both a buyer and a seller. “Buying” and “selling” in the executed columns describe the aggressor side—the side classified as taking the available bid or ask—not a claim that only buyers or only sellers participated.
Aggressor classification depends on the trade and quote data supplied by your connection. It does not reveal who placed an order or guarantee that every trade can be correctly assigned.
Think of it this way: a resting buyer waits at the bid; an aggressive seller trades into that bid. A resting seller waits at the ask; an aggressive buyer trades into that ask.
Green resting bids are buyers waiting. Green buying at ask is buyers executing. Keep the column heading in mind. Colours are customizable defaults, not universal rules used by every platform.
05
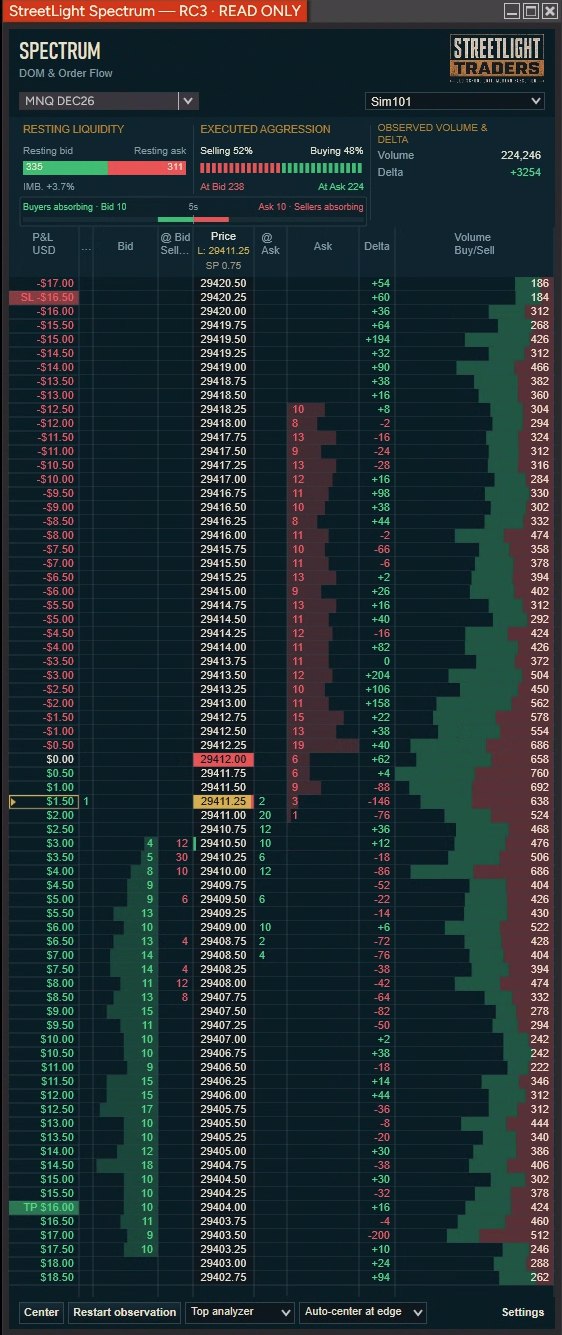
Every ladder column, explained
Columns can be hidden, rearranged and resized, so their order on your screen may differ. These descriptions follow the familiar bid/price/ask relationships.
Buy orders waiting
Bid
What it shows. The displayed quantity of buy limit orders resting at this price. It is a current book measurement, not completed trading volume.
How to watch it. Watch how displayed size changes as price approaches and trades occur. A bid can change or disappear without being filled, so a large bid is not guaranteed support.
Sellers trading into the bid
@ Bid Selling
What it shows. Recent executed quantity classified as selling at the bid at this price. These are completed trades against resting buyers.
How to watch it. Compare this activity with the resting Bid and the subsequent price movement. These recent counters can clear or fade according to the observation settings; they are not the cumulative sell component of the Volume profile.
The ladder’s price levels
Price
What it shows. The price represented by each row. L: in the header is the latest reported trade price; SP is the current ask minus bid, expressed in price units. The last-traded row is highlighted.
How to watch it. Use price as the reference for everything else on the row. With spread markers enabled, green and red edge marks identify the best bid and ask. A tick is a price increment, not one contract.
Buyers trading into the ask
@ Ask Buying
What it shows. Recent executed quantity classified as buying at the ask at this price. These trades take liquidity from resting sellers.
How to watch it. Read this alongside the resting Ask and price response. Heavy buying can accompany a rise, a stall or a fall later; the number describes what traded, not what must happen next.
Sell orders waiting
Ask
What it shows. The displayed quantity of sell limit orders resting at this price. Like Bid, it is current displayed liquidity rather than executed volume.
How to watch it. Watch changes as trades reach the offer. A large ask is not guaranteed resistance, and a disappearing ask does not by itself tell you whether it traded, was cancelled or moved.
The latest reported trade size
Last qty
What it shows. The quantity in the most recent trade update, shown at its price. It is not the total trading volume at that level and does not reveal one trader’s full order.
How to watch it. Use it to notice the size of the latest reported print. A larger order may be reported through multiple updates; Last qty is not an order-identity or queue-position display.
Net classified execution
Delta
What it shows. Cumulative buying-at-ask volume minus selling-at-bid volume at this price during the current observation. A positive number means more classified ask-side buying; a negative number means more classified bid-side selling.
How to watch it. Compare delta with total Volume and price response. +14 means 14 more classified buy contracts than sell contracts—not that only 14 contracts traded. Unclassified trades contribute to Volume but not directional delta.
All observed trading at this price
Volume
What it shows. The total contracts Spectrum has observed trading at this price during the current observation. It includes classified buys, classified sells and any unclassified trades. It does not add resting orders that have not traded.
How to watch it. Use the bars to compare activity across observed prices. Total mode uses one bar; Buy/Sell mode separates the classified buying and selling components. The printed number remains the total. An unclassified component uses the Volume colour.
Your position valued at each price
P&L
What it shows. When an eligible Cassette account is linked, this column shows the position’s projected gross profit or loss if valued at each ladder price. It uses the selected account’s position and average entry—not the number typed into an order-entry quantity box.
How to watch it. The yellow outline follows the current last-price row in the P&L column. Other rows are hypothetical price outcomes, not separate profits already earned. Choose Auto, Always or Hidden in Accounts & P&L. See the position section for units and markers.
A note about bar widths
Bars use relative scales. If a much larger quantity enters the comparison, other bars may become narrower even when their printed quantities have not changed. Read the numbers as well as the widths. Width alone cannot tell you that orders were pulled.
Optional historical resting references
If enabled, faint resting-reference bars retain recently observed book quantities for up to 30 seconds after a price leaves the observed book. They disappear at that price when live resting data is present. They are earlier observations, not confirmed current orders, a full historical depth replay or a position in a queue.
Back to top ↑06
Volume and delta: one worked example
Suppose a row shows Volume 136 and Delta +14. If all 136 contracts were classified, the breakdown is:
75 + 61 = 136 total contracts. 75 − 61 = +14 delta. The buy and sell amounts are two classifications of executed volume; you do not count both participants in each trade as two contracts of volume.
If unclassified trades are present, you cannot recover the exact buy/sell split from total volume and delta alone. For example, 70 buys + 56 sells + 10 unclassified still gives Volume 136 and Delta +14.
The short-window Executed aggression percentages and recent @ Bid / @ Ask counters can show a different balance from this cumulative profile. They measure different time spans.
Back to top ↑07
The analyzer summaries
Resting liquidity: what is waiting?
The green and red segments compare currently displayed bid and ask quantities across the available book. Spectrum compares an equal number of available levels on each side. These totals are limited to the depth your feed provides, not the entire exchange’s order book.
IMB. is the displayed-liquidity imbalance: (bid quantity − ask quantity) ÷ combined quantity. A positive value means more displayed bid quantity in this comparison; a negative value means more ask quantity. It is not a probability that price will rise or fall.
How to watch: compare the waiting liquidity with what actually executes as price reaches it. Waiting orders can be changed or withdrawn.
Executed aggression: what is trading?
This compares classified selling at bid with buying at ask over your selected rolling lookback—5, 15, 30 or 60 seconds. “At Bid” and “At Ask” show the corresponding executed contract counts. Percentages use classified buying and selling; trades that cannot be classified are not forced onto either side.
How to watch: look for changes in the recent balance, then observe price’s response. A longer lookback is steadier but responds more slowly; a shorter one changes sooner. Neither is automatically better for every instrument.
Observed volume & delta: what has accumulated?
These are the totals across the instrument’s observed prices, including prices currently off-screen. Volume includes unclassified executions; delta uses classified buys minus sells. They accumulate from the current observation’s start—not automatically from midnight, the exchange session open or your chart candle.
Resting liquidity is a current snapshot. Executed aggression is a rolling recent window. Observed Volume/Delta is cumulative for this observation. They need not agree, because they are answering different questions.
08
Understanding the absorption view
Absorption describes the situation where aggressive trading meets opposing liquidity and achieves limited price progress. Spectrum’s optional meter summarizes a potential absorption pattern from observed executions and price travel. It does not identify a particular trader or prove that someone is defending a price.
| Side of the meter | What it summarizes | What it does not mean |
|---|---|---|
| Buyers absorbing · Bid | Classified selling at a bid-side price, with limited subsequent trading below that price within the lookback. | It is not aggressive buying, a count of buyers, or a promise that price will bounce. |
| Sellers absorbing · Ask | Classified buying at an ask-side price, with limited subsequent trading above that price within the lookback. | It is not aggressive selling or a promise that price will reverse downward. |
What are the Bid and Ask numbers?
They are qualifying executed contract counts. Within the lookback, Spectrum examines the price with the most classified selling and the price with the most classified buying, separately. Each side qualifies only if subsequent trade-through stays within your selected tick allowance. The meter does not add every price into a single absorption total.
What does the scale mean?
Both halves use the same recent five-minute activity reference for this instrument and Spectrum window. They are independent activity levels, not a 100% buyer-versus-seller split. Both sides can be active together, or both can be empty. A full green half does not mean “100% chance of going up.”
Lookback and maximum trade-through
- Lookback: the recent 5, 15 or 30 seconds used to examine executions.
- Maximum trade-through ticks: the allowed adverse price travel after executions begin at the selected price. For bid-side selling, this is travel below that price; for ask-side buying, it is travel above it.
- A higher tick allowance accepts a looser limited-movement condition. It does not make the result more accurate or more predictive.
The reading can disappear as executions age out or the price-travel condition is exceeded. Returning to the level does not erase an earlier breach within the lookback. During warmup or unavailable/incomplete data, the meter may have no valid reading; an empty meter is not proof that no absorption exists anywhere.
A useful way to read it
If selling at bid grows while a bid-side reading is present, watch whether price holds, trades through or returns. If buying at ask grows while an ask-side reading is present, watch the equivalent behaviour at the offer. The observation and the later price response are separate pieces of information. Spectrum does not turn them into an entry instruction.
Back to top ↑09
Choose a layout
Start with the view you find easiest to read. Changing the analyzer layout does not create a new instrument observation.
| Layout | What changes | Useful when |
|---|---|---|
| Top analyzer | The summaries sit above the ladder. | You want the order-flow summary close to the price ladder. |
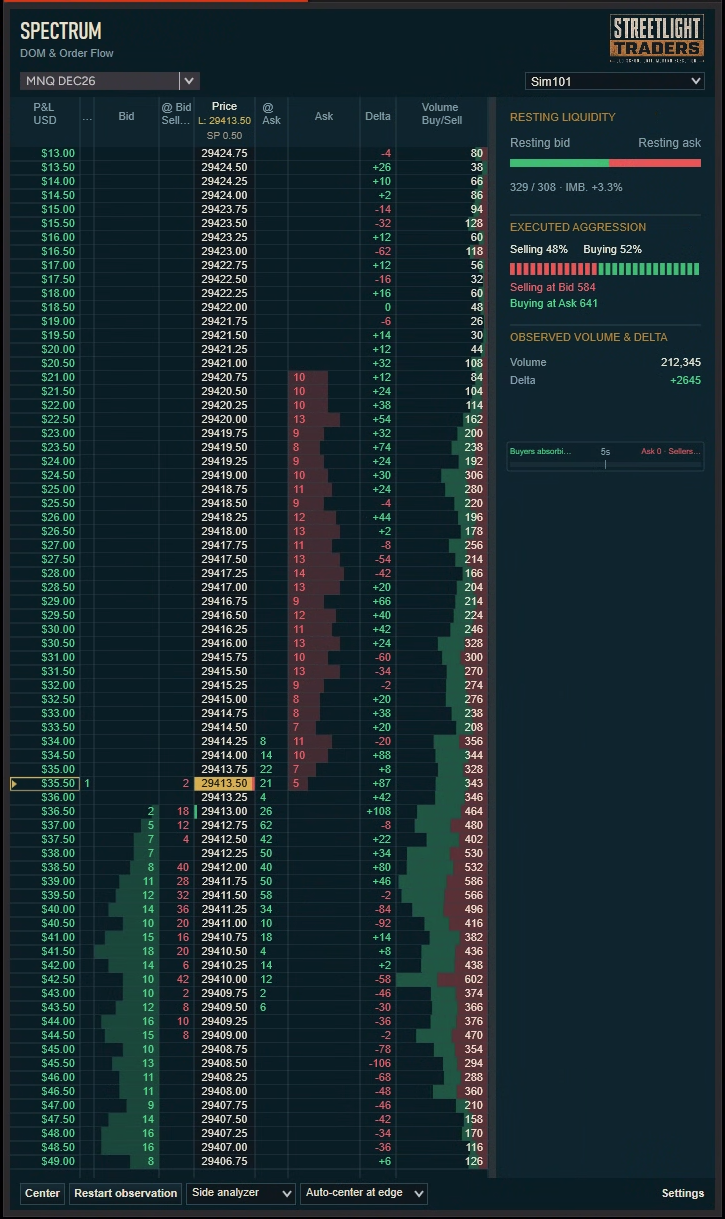
| Side analyzer | The summaries sit beside the ladder. | You have more horizontal screen space. |
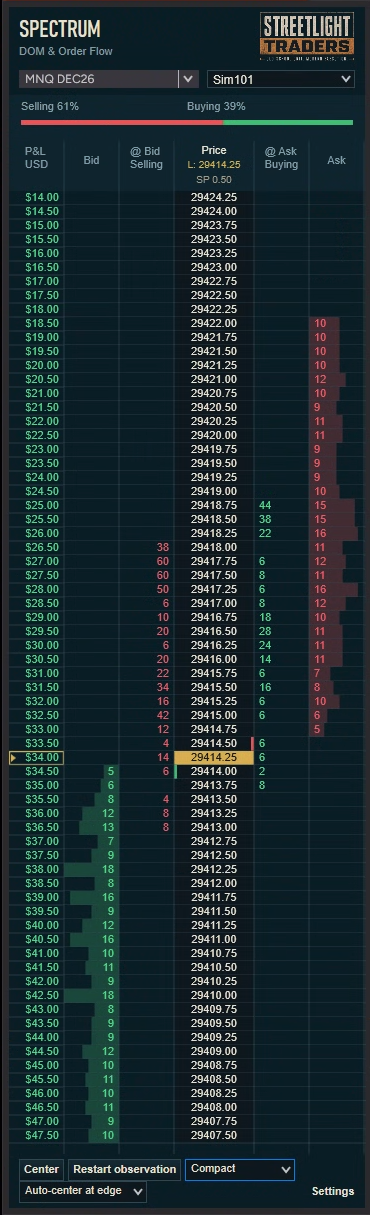
| Compact | A reduced summary and column set saves width. Volume and Delta are omitted; Last qty is optional. | You want the essential ladder in a narrower window. |
Resize column dividers to redistribute width between neighbours; the right edge of the last column can use available ladder space. Drag headings to rearrange columns. The summary area has a minimum width to keep its text readable.
11
Connect Cassette Deck & read your position
Spectrum’s enhanced position display requires an operational, licensed Cassette Deck publisher. Merely having Cassette installed is not enough. If that context becomes unavailable, Spectrum withholds position information; its free market features remain available while market data is healthy.
- Install Cassette separately and open it on an eligible chart. Connect the required account and feed.
- In Spectrum, choose the instrument you want to observe.
- Select the account in Spectrum’s upper-right dropdown. Connected eligible accounts can be selected independently for each Spectrum window.
- If needed, open Settings → Accounts & P&L, use Refresh contexts, choose the account and click Link.
- Verify the selected account and full instrument before interpreting a position. Practice in SIM first.
Account and instrument are separate choices. Selecting another account in Spectrum does not change Cassette’s account, Chart Trader, TapeDeck or Spectrum’s instrument. Spectrum observes; it does not synchronize execution selections back into those tools.
P&L units
| Unit | How to read it |
|---|---|
| Dollars | Gross position P&L, including position quantity, for supported USD-denominated instruments. Displayed with a dollar sign and cents; −$2.00 is a loss. Fees and slippage are excluded. |
| Points | Directional price movement per contract from average entry, not a quantity-multiplied dollar result. |
| Ticks | Directional movement per contract expressed in the instrument’s minimum price increments. |
For a long position, prices above average entry produce positive projected P&L; for a short position, prices below entry do. Adding or reducing a position can change both quantity and average entry. Spectrum uses the current confirmed position. Its current-price highlight and Cassette’s live P&L may briefly differ because of update timing and valuation price; the ladder uses the displayed last price.
Entry and protection markers
- Entry: a green Price-cell background for a long position or red for a short position. An average entry between ticks is represented by its nearest ladder cell; P&L still uses the exact average.
- SL / TP: verified stop/target markers on the P&L ladder at their prices. A marker outside the visible price range requires scrolling or a wider visible range to see.
- Yellow P&L outline: identifies the current last-price row, separate from the entry marker.
Protection is shown only when it can be positively matched to the relevant Cassette account, instrument and position context. An account can have a visible position/P&L without a verified bracket source. Missing markers do not by themselves mean no orders exist; check Cassette and NinjaTrader’s Orders display.
Separate resting entry orders are not automatically displayed as stop-losses or targets. Spectrum does not guess protection from an order’s position above or below market.
Auto / Always / Hidden
- Auto (default): shows the P&L column for an open, available linked position; hides it when flat.
- Always: reserves the column even when flat. Without a valid open position, values are blank.
- Hidden: removes the column from view. Position monitoring and calculations continue.
The preference does not place trades or change the selected account’s position. It saves with your display settings.
Back to top ↑12
Settings: make it comfortable
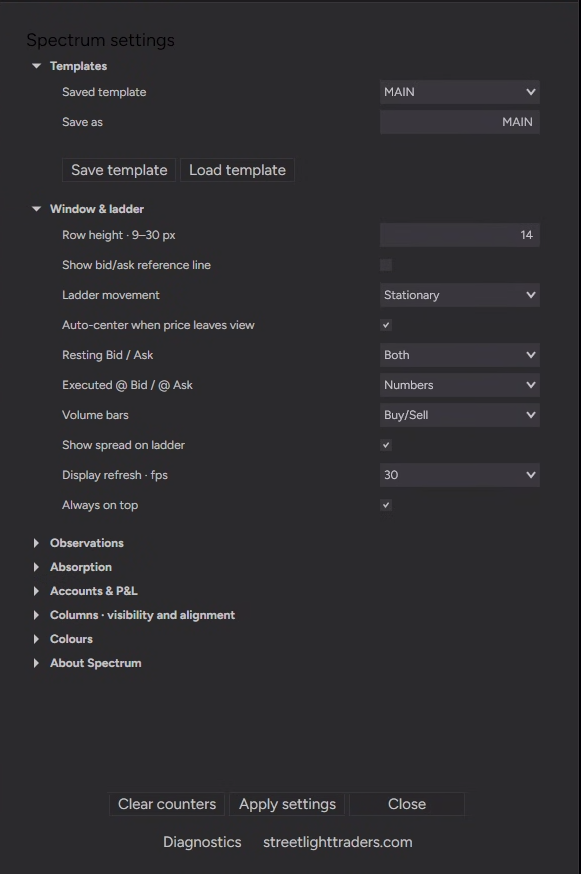
Open Settings at the bottom-right of Spectrum. Related controls are grouped into collapsible sections. Expand only the section you need, make changes, then click Apply settings. Close exits the dialog; it is not the Apply button.
Templates
To create an instrument-friendly layout, enter a name in Save as and choose Save template. Saving captures and applies this window’s controls. To reuse one, choose it from Saved template and click Load template; confirm replacement or loading when prompted.
A template stores appearance and display preferences, not a saved trading session, market history, account authorization or orders. Loading a template on the same instrument does not recreate earlier market activity.
Window & ladder
- Row height: taller rows are easier to read; smaller rows show more prices.
- Show bid/ask reference line: toggles the optional quote reference line.
- Ladder movement / Auto-center: the same centering choices described above.
- Resting Bid / Ask: numbers, bars or both.
- Executed @ Bid / @ Ask: numbers, bars or both for recent executions.
- Volume bars: Total or Buy/Sell. Both show total observed contracts as the number.
- Show spread on ladder: toggles the bid/ask edge markers in Price.
- Display refresh: choose 10, 15, 20, 24 or 30 frames per second. Lower rates can reduce display load but look less smooth; this is a rendering preference, not a request to sample fewer trades.
- Always on top: keeps Spectrum above other windows.
Observations
Executed aggression · seconds changes the rolling summary window. Return-to-price tolerance controls how quickly a return to a price starts a new recent @ Bid / @ Ask visit counter. Clear recent display after inactivity and its timeout control the visibility of inactive recent executions. Show previous-visit bars until timeout can show their fading references. These recent-display settings do not turn the cumulative Volume column into a short-window chart.
Clear counters, at the foot of Settings, clears the recent @ Bid / @ Ask visit counters and their previous-visit references. It does not clear cumulative Volume/Delta. Use Restart observation when you deliberately want a fresh cumulative profile.
Absorption
Turn the optional view on or off, choose its lookback and set maximum trade-through ticks. Read Understanding the absorption view before interpreting its colours or changing its tolerance. Changing analytical lookbacks can require that reading to warm up again; it does not make old trades newly available.
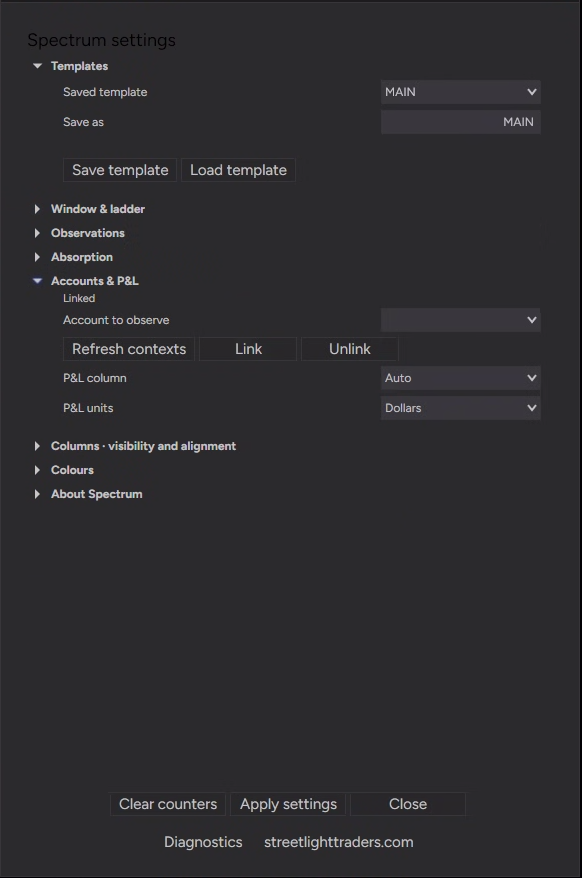
Accounts & P&L
Refresh available contexts, Link or Unlink an account, and choose the P&L visibility mode and units. This section can stay collapsed during normal use.
Columns · visibility and alignment
Choose which optional columns appear and align text Left, Centre or Right. The Price column remains available as the ladder’s reference. Compact has its own limited column set and an option to include Last qty. Column widths and order can also be adjusted on the ladder itself.
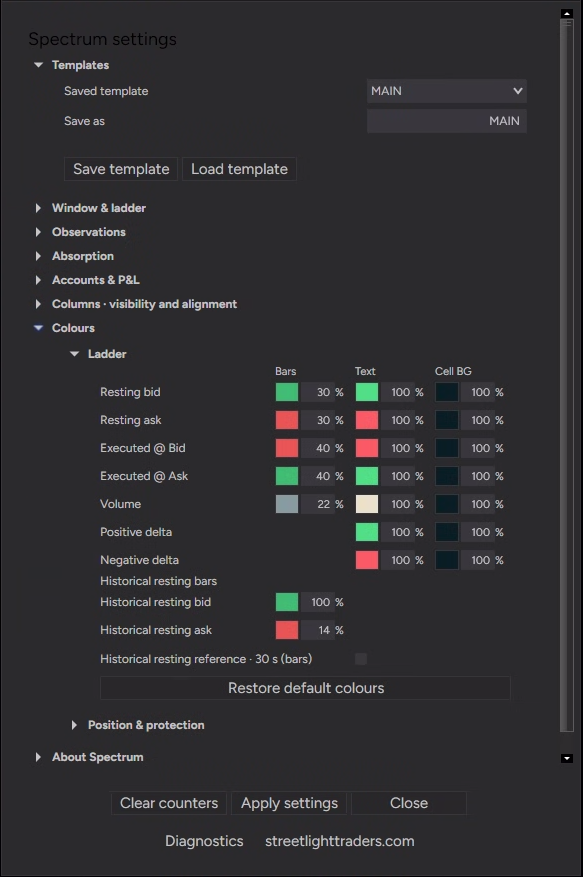
Colours
The Ladder section separates Bars, Text and Cell BG. Click a colour swatch to choose a colour. The percentage beside each swatch controls its own opacity: 0% is transparent and 100% is fully opaque. It is not a single global intensity setting.
Historical resting bars have separate colours/opacity and a 30-second reference toggle. Position & protection holds the P&L, stop, target and entry colours. Restore default colours in the Ladder section resets those ladder colours; it is not a reset of your trading position or market history.
About and Diagnostics
About identifies the build. Diagnostics is for troubleshooting observation/connection issues; it is not another market indicator. Review any diagnostic text before sharing it, because linked account or instrument details may be present.
Back to top ↑13
What stays, and what starts again
This distinction matters if you have been collecting activity for twenty minutes and want to keep it.
| Action | What happens to the instrument observation |
|---|---|
| Choose another account, same instrument and healthy data connection | Accumulated market volume/delta continue. Position overlays change to the newly selected account. |
| Change MNQ → MES → MNQ | Each instrument change starts a fresh observation. Spectrum does not keep a background profile waiting for you to return. |
| Center, scroll, resize, change colours or analyzer layout | The existing market observation continues. |
| Change a short analytical lookback | The affected recent reading can warm up/recalculate. This is separate from cumulative market volume/delta. |
| Restart observation | A fresh subscription/observation begins; cumulative totals restart. |
| Close/reopen Spectrum or restart NinjaTrader | A new market observation begins. Restored geometry/preferences are not restored market history. |
| Disconnect an unrelated connection | Observation continues only when Spectrum can verify its actual price and depth routes remain unchanged and healthy. |
| Actual feed loss, native reset or unqualified interruption | Observation is stopped/withheld. After recovery, Restart observation begins fresh; missing trades are not reconstructed. |
To keep both MNQ and MES accumulating, open a separate Spectrum window for each. Switching one window between them does not preserve both profiles. Each window has its own observation and can have its own account/display choices.
Save the NinjaTrader workspace to retain supported window placement, size and preferences. A restored workspace is not a replay of trades collected before shutdown. Confirm and re-establish the account link if prompted; an authorized live context is not supplied by an appearance template.
Back to top ↑14
If observation stops
Spectrum may stop or withhold data after an actual price-feed interruption, book reset or data-validation problem. Previously displayed values are not presented as current market data.
- Check NinjaTrader’s connection status and confirm the intended price/depth feed is healthy again.
- If the problem is recurring, capture Spectrum Diagnostics before restarting. Include the build, fault reason and connection/route information when reporting it privately.
- Click Restart observation. Allow prices and depth to establish again.
- Confirm the account selection and linked position, entry and any verified protection. Relink if prompted.
Restart deliberately begins a fresh observation. It does not fill the missing interval or recover the earlier cumulative profile. It does not cancel, close or otherwise change a trading position. Check positions and orders in Cassette/NinjaTrader independently.
An unrelated broker disconnect is not supposed to reset a verified, unaffected data route. If Spectrum cannot establish that distinction, it keeps the conservative restart requirement. Do not assume “my SIM account is selected” identifies which provider supplied market data.
Back to top ↑15
Updates and removal
Updating
Save your workspace and update at a safe time. Use the new official Spectrum import ZIP and follow its release instructions. If the importer asks to replace files, confirm only the intended product update. Fully exit and restart NinjaTrader afterwards, then check the build and test your layout/account link in simulation.
Do not leave old development or probe copies mixed with the packaged release. If you previously installed development source manually, use the migration instructions supplied with the final package; do not guess which shared components to delete.
Removing Spectrum
Close Spectrum windows first. For a packaged protected assembly, NinjaTrader provides Tools → Remove NinjaScript Assembly; select the Spectrum assembly only. A source-based install uses a different removal process in NinjaScript Editor. Follow the instructions for the package you actually installed. Removing Spectrum is separate from removing Cassette Deck or TapeDeck.
The NinjaTrader AddOn guide explains the two installation types. Avoid manual deletion of workspace files as a routine update step.
Back to top ↑16
Quick answers
| Question | What to check |
|---|---|
| Why is my ladder empty? | Check the full contract, feed connection and Level 2 entitlement. A connected trading account alone does not guarantee depth data. Read any observation status message. |
| Why is there no Cassette account? | Cassette must be licensed, operational and publishing a valid connected context. Refresh contexts, verify connection/account/instrument, and link again if needed. |
| Why is P&L blank? | Check account, contract and open position. Auto hides flat; Always can show an empty lane; Hidden removes it. Unsupported dollar valuation or unavailable/stale context can withhold values. |
| Why do my brackets not appear? | They must be within view and positively verifiable for the selected position/context. Independent entry orders are not protection. Verify real order state in NinjaTrader/Cassette. |
| Why do bars shrink without numbers changing? | The comparison scale may have increased because of a larger visible quantity. A relative width change alone is not evidence of cancellation. |
| Why do recent execution numbers disappear but Volume stays? | Recent visit counters have timeout/return behaviour. Volume/Delta are cumulative for the observation. |
| Why does Buy/Sell volume not match the aggression percentage? | The profile accumulates since observation start; the aggression percentage uses a rolling window. Unknown executions also affect total volume. |
| Why does absorption flash on and off? | Its lookback rolls forward and its trade-through condition can stop qualifying. It is an activity summary, not a latched signal. |
| Why does Spectrum use more resources with several windows? | Each window observes and renders separately. Try fewer windows or a lower display refresh rate. Remote-desktop smoothness is also affected by the connection and display path. |
| Why did switching instruments clear my profile? | Instrument changes intentionally begin fresh. Use separate windows to keep multiple observations running. |
If NinjaTrader cannot start normally after an AddOn change, follow NinjaTrader’s documented Safe Mode procedure and preserve diagnostic information. Do not repeatedly delete workspaces or reinstall unrelated products without identifying the failing component.
Back to top ↑17
A small DOM vocabulary
| Term | Plain meaning |
|---|---|
| Bid / ask | The best currently quoted buying / selling prices; the depth columns show additional available price levels. |
| Spread | The difference between the best ask and best bid. |
| Resting liquidity | Displayed limit quantity waiting in the book. It can change before a trade occurs. |
| Aggressor | The classified side of a completed trade taking available liquidity. |
| Tick | The instrument’s smallest price increment. Tick size and the money value of a tick are different concepts. |
| Contract volume | How many contracts traded, not how many individual traders participated. |
| Delta | Classified buying-at-ask volume minus classified selling-at-bid volume over the stated measurement period. |
| Flat | No open position for the selected account and instrument. |
| Observation | The uninterrupted period of market activity collected by this Spectrum window. |
| Potential absorption | A pattern of execution with limited adverse price travel. It does not reveal participant identity or guarantee a reversal. |
Learn it here. Recognize it anywhere.
Spectrum uses familiar DOM relationships so the concepts transfer to other platforms. Depth availability, aggressor classification, colours and display conventions can differ. Spectrum does not provide full market-by-order data, order identities, queue position, a guaranteed historical reconstruction or trading signals.
Back to top ↑